
See the batteries running in Britain and Italy, and everything waiting to join them.
In Britain, what each one is paid, who owns it, who trades it, and which of the 426 GW in the queue is likely to fail. In Italy, every project the public record names and the 290 GW asking to connect. Read from the published registers: Britain’s twice a week, Italy’s every month.
Great Britain: the haze is the 243 GW of the queue at points with a known position; the other 182 GW sits at points with no published location. One operating site with no published position, 58 MW, is not drawn. Italy: the haze is Terna’s 290 GW, at the centre of each municipality, the closest Terna publishes; the points are 28 of the 29 running batteries the public record names, at their municipality.
Across Europe: the day-ahead price, country by country, read for batteries →
One real day
On Sunday 27 September the grid paid batteries to charge at lunchtime, then wanted power back at £202 by half past six.
The imbalance price each half hour, on the day with the widest swing of the seven to 3 October. Watch a four hour battery fill up while the price is below zero and empty in the evening.
Two markets, read the same way
The same method in each country: the connection register, the operating fleet and what the fleet is paid, all from published files, rebuilt on every refresh.
Great Britain
Registers read twice a week since August 2026Italy
Read monthly from Terna since 5 October 2026Three products
The register is free because it traces to published files. The work we add sits behind a key.
The Fleet
Every operating battery: what it earns, who owns it, who trades it, and what it is doing right now, measured from settlement rather than modelled.
The Development Atlas
The connection queue on a map: what is contracted, what is likely to fail, where capacity comes back, and what changed since the last read. Who is really behind each project is the part we resolve ourselves.
The Forecast
Tomorrow’s price, published each morning before the auction, and the long term view drawn from every public report so a page never shows nothing.
Latest findings
Short pieces written from the data, each one traceable to the files it was read from.
The company that sells a battery’s power usually does not own it
We followed the control filings behind every operating battery in Britain. On 119 of the 183 we can name, the company selling into the market is somebody else entirely. Coverage stands at 86 per cent of operating capacity.
Read it →
120 GW of the queue is contracted at connection nodes with no published location
122 strategic connection nodes created by the connections reform hold 120 GW of contracted storage between them. No published source places any of them, and they hold not one megawatt of Gate 2.
Read it →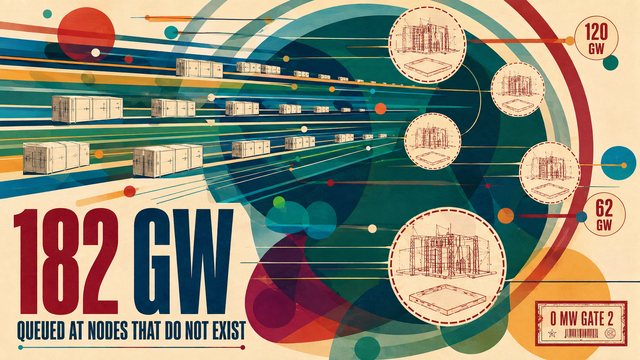
A battery in North Scotland is turned down 42 times as often as it is turned up
A full year of Elexon settlement data across the traded fleet shows a north to south gradient: the further north an asset sits, the more the system uses it as a sink and the less it earns. Two small English zones interrupt it.
Read it →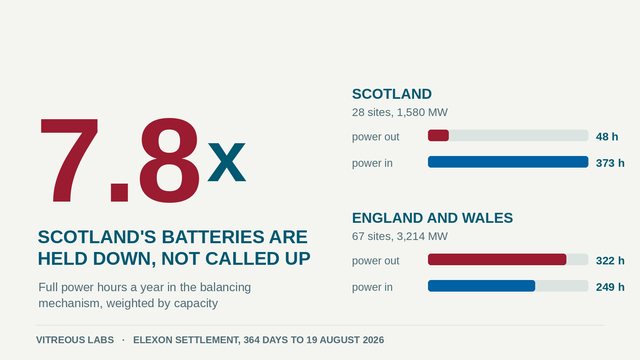


How it is kept honest
Every number traces to a published file or is labelled as inference. The three marks below appear on every map and every page.
How every number is worked out · What you may do with each layer
The Friday ledger
Every Friday, every change in the queue since the last read: new requests, withdrawals, dates that moved, capacity that came back. One email, no commentary you did not ask for.
Confirm by email, unsubscribe from any issue. We store the address and nothing else.
The ledger covers Great Britain today and Italy from its first monthly read.