
Great Britain runs 7.8 GW of batteries and has 426 GW waiting to connect
Connection register read 29 September 2026. Balancing and auction data to 27 September 2026, two days ago. Capacity market register read 19 August 2026. Rebuilt on every refresh.
Live · the operating fleet, right now
Reading the fleet.
Reading the last 24 hours.
Reading the price.
Reading a week of prices.
The first three refresh every five minutes, the last one hourly. All four are measured rather than modelled. How they are worked out
Vitreous Labs reads NESO's connection registers twice a week alongside the capacity market, the planning database, Companies House and a full year of balancing mechanism settlement, and maps what is contracted, what is likely to fail and where capacity comes back.
Why a queue tool rather than a siting tool
NESO's connections reform allocated every megawatt of permitted battery capacity in all nineteen zones. 99.4% of the 83.2 GW Gate 2 book went to projects that were already protected, leaving 471 MW for everything else and nothing at all in the 2031 to 2035 phase. There is no open door to walk through.
So the useful question changes. Not where should a battery go, but which of the positions already in the queue will not be delivered, when that becomes visible, and at which substation the capacity returns. That is an attrition question, and it is answerable from published data if you read it carefully enough.
What is actually in it
| Layer | Records |
|---|---|
| Storage projects in the connection register | 1,565 |
| Connection points, 601 of them mapped | 952 |
| Capacity market battery agreements with duration, across 1,803 named units | 2,737 |
| Planning records from the renewable energy planning database | 2,668 |
| Transmission circuits and substations | 18,231 |
| Battery units registered in the balancing mechanism | 135 |
| Project rows matched to a live Companies House record, of 1,565 | 1,530 |
Four counts on this site look alike and are not. 135 is battery units on Elexon's balancing mechanism register when it was read, 29 September 2026. 250 is registrations the grid operator paid in the year to 27 September 2026, across the balancing mechanism and the response and reserve auctions together: 108 of them balancing mechanism units and 142 auction only. 206 is physical battery sites, a battery split across several registrations counted once, which is what the operating map and the asset directory count. 1,565 is storage projects in the connection register, most of them not yet built.
Two tools
The queue tool maps what is contracted and what is likely to fail. The operating tool maps the batteries that already exist and what the balancing mechanism actually pays them, with live positions.
Every operating battery also has its own page, 206 sites, with what it earns, who owns it and who trades it.
Latest findings
The company that sells a battery’s power usually does not own it
We followed the control filings behind every operating battery in Britain. On 119 of the 184 we can name, the company selling into the market is somebody else entirely. Coverage stands at 87 per cent of operating capacity.
Read it →
120 GW of the queue is contracted at connection nodes with no published location
122 strategic connection nodes created by the connections reform hold 120 GW of contracted storage between them. No published source places any of them, and they hold not one megawatt of Gate 2.
Read it →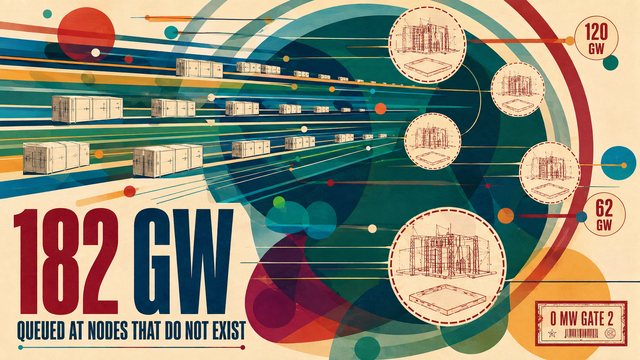
A battery in North Scotland is turned down 39 times as often as it is turned up
A full year of Elexon settlement data across the traded fleet shows a north to south gradient: the further north an asset sits, the more the system uses it as a sink and the less it earns. Two small English zones interrupt it.
Read it →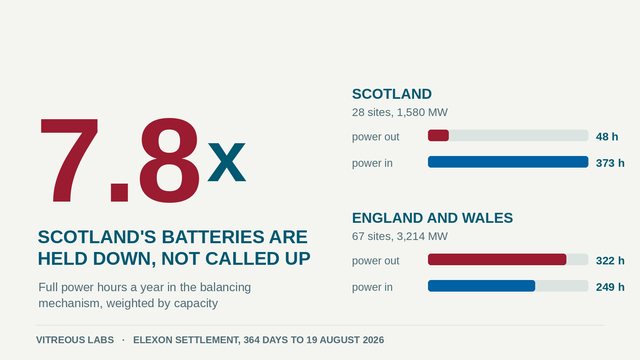


How it is kept honest
Every number traces to a published file or is labelled as inference. Where a coordinate is inferred rather than published, the mark on the map is drawn differently and the popup says how it was derived. Where the published data is ambiguous, the tool says so instead of picking a reading. Data that is absent is never invented.
How every number is worked out · What you may do with each layer